Picture this: The bases are loaded at the bottom of the ninth inning. A batter steps up to the plate, scuffs his sneakers against the mud-caked marker that signals home, and glares at the pitcher’s mound. The crowd roars as the pitcher nods to the catcher and winds up for the throw. In the blink of an eye, the fastball slices through the air at nearly 90 miles per hour. Will the batter get a hit and enable at least one run? Or will he miss and disappoint his team?

To answer this question, you might choose to focus on the usual statistics—batting average, RBIs, hits, and stolen bases. The player’s overall past performance is usually an indicator of his future success, right?
What if these statistics aren’t the best predictors of whether a player can perform under pressure? This is the premise behind moneyball theory, which emphasizes only two important data points as predictors of a player’s abilities:
- Slugging percentage: Total bases divided by at-bats.
- On-base percentage: The rate at which a batter gets on base for any reason excluding fielding errors, fielder’s choice, fielder’s obstruction, or catcher’s interference.
Essentially, moneyball theory seeks to answer these two very basic questions: Can the player hit? Can the player create runs? If the answer to one or both of these questions is “yes,” chances are you’ve got a good pick on your hands—and one who can perform when duty calls.
At least that’s what Oakland A’s general manager Billy Beane believed in 2002 when he used moneyball theory to pick a team of undervalued players that would eventually go on to achieve a 20-game winning streak and clinch the American League West. These moneyball-inspired picks came in the wake of Beane losing three highly valuable players—Jason Giambi, Johnny Damon, and Jason Isringhausen—to free agency.
Moneyball Theory in Action
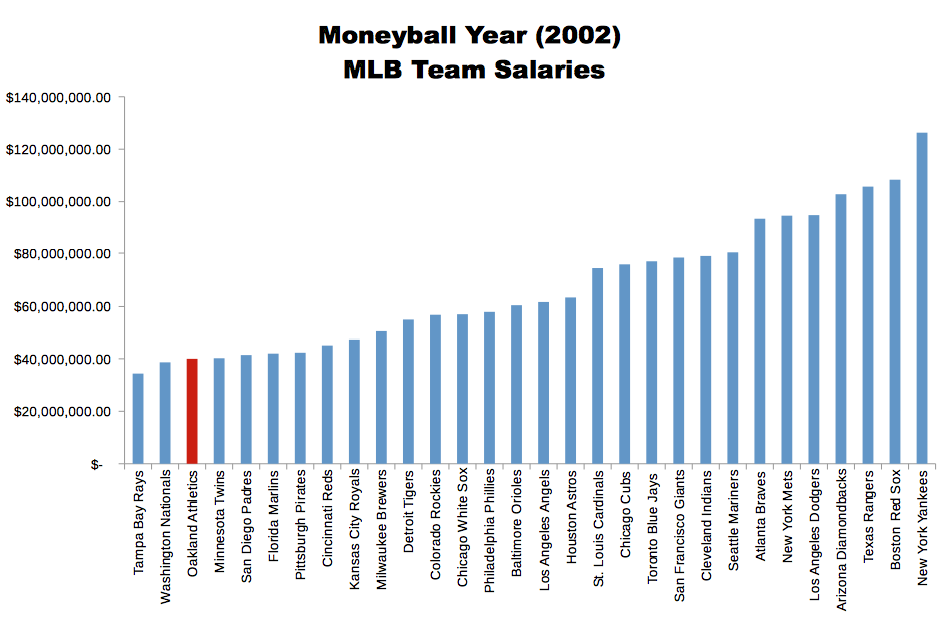
Using data analytics and moneyball theory, Beane hired the best players he could with an extremely limited budget for payroll. With approximately $41 million in salary, the Oakland A’s ultimately competed with larger market teams such as the Yankees, who spent over $125 million in payroll during the 2002 baseball season.
Exactly how did he do it?
Beane performed data mining on hundreds of individual players, ultimately identifying statistics that were highly predictive of how many runs a player would score. These statistics weren’t necessarily numbers that baseball scouts traditionally valued. Instead of competing for high-priced home-run hitters with high batting averages, he sought lower-cost players with high on-base percentages. His theory was that players with a higher on-base percentage would be more valuable than those with lower on-base percentage even when those with the lower percentage ultimately hit more home runs and were faster and even stronger. He also encouraged players to focus on walks, thereby forcing pitchers to throw strikes to ensure an out.

Effects of Moneyball Theory on Baseball
Between 2000 to 2006, the Oakland A’s went on to average 95 wins, capture four American League West titles, and make five playoff appearances. Although baseball scouts and general managers initially scoffed at moneyball principals, they slowly began to realize the validity of the theory and sought to take advantage of it. The Red Sox tried to hire Billy Beane but were unsuccessful. Instead, they hired Bill James—the creator of sabermetrics on which moneyball theory is based—in an advisory capacity.
Over the years, Beane’s moneyball theory has had a lasting legacy in baseball, allowing teams with significantly lower budgets to choose players that would allow them to successfully compete with big-market teams such as the Red Sox and Yankees.
According to a 2013 article on MLB.com, “Moneyball has played a role in 15 of 30 teams getting into at least one postseason series—not a Wild Card Game, but a postseason series—the last three years. Moneyball may also be why nine franchises have won the World Series the last 13 seasons.”
What Data Scientists Can Learn from Moneyball
Today, the story of Billy Beane and moneyball theory is famous. It was the subject of Michael Lewis’ book Moneyball and the film of the same name. But according to Forbes, “What’s interesting is that as widely-familiar as the story is, it is almost as widely misunderstood.”
Analyzing data was nothing new to baseball in 2002. Data on baseball players has been available since the 1800s and data analytics used since the ’70s.
The reason Beane’s strategy was ground-breaking is because he “had the courage to use the insight gleaned from data analytics to drive the way he ran his business… ‘Moneyball’ succeeded for the Oakland A’s not because of data analytics but because of Beane, the leader who understood the analytics’ potential and changed the organization so it could deliver on that potential.”
His story should resonate with data scientists. It speaks to the advantage of making data science part of an organization’s DNA, but just as importantly, it highlights how a big idea about big data can translate to serious business gains.
Interested in the online 36-credit University of Wisconsin Master of Science in Data Science? Start exploring the degree program here.
Read More Data Science Stories
Can I be a Data Scientist? Healthcare Analytics in Health Information Management and Technology
Data Science vs. Data Analytics: The Differences Explained
Why Combining Psychology, Research Methods and Statistics Can Lead to a Powerful Data Science Career