


What is big data? That’s a good question. There seems to be as many definitions for big data as there are businesses, nonprofit organizations, government agencies, and individuals who want to benefit from it.
One popular interpretation of big data refers to extremely large data sets. A National Institute of Standards and Technology report defined big data as consisting of “extensive datasets—primarily in the characteristics of volume, velocity, and/or variability—that require a scalable architecture for efficient storage, manipulation, and analysis.” Some have defined big data as an amount of data that exceeds a petabyte—one million gigabytes.
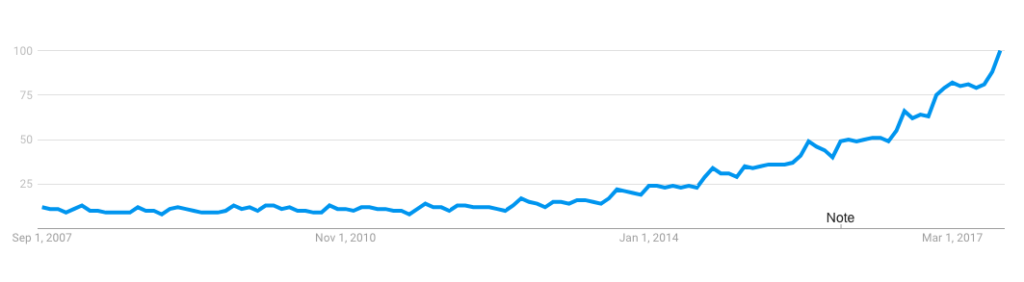
Another definition for big data is the exponential increase and availability of data in our world.
This data comes from myriad sources: smartphones and social media posts; sensors, such as traffic signals and utility meters; point-of-sale terminals; consumer wearables such as fit meters; electronic health records; and on and on.
Buried deep within this data are immense opportunities for organizations that have the talent and technology to transform their vast stores of data into actionable insight, improved decision making, and competitive advantage.
By harnessing the power of big data, healthcare systems can identify at-risk patients and intervene sooner. Police departments can predict crime and stop it before it starts. Retailers can better forecast inventory to optimize supply-chain efficiency. The possibilities are endless.
But to fulfill this promise, organizations need qualified professionals with the skills to extract meaning from the mountains of data—and these elusive data scientists are in short supply.
The “Three Vs” of Big Data
In 2001, industry analyst Doug Laney defined the “Three Vs” of big data:
-
Volume
The unprecedented explosion of data means that the digital universe will reach 180 zettabytes (180 followed by 21 zeros) by 2025. Today, the challenge with data volume is not so much storage as it is how to identify relevant data within gigantic data sets and make good use of it.
-
Velocity
Data is generated at an ever-accelerating pace. Every minute, Google receives 3.8 million search queries. Email users send 156 million messages. Facebook users upload 243,000 photos. The challenge for data scientists is to find ways to collect, process, and make use of huge amounts of data as it comes in.
-
Variety
Data comes in different forms. Structured data is that which can be organized neatly within the columns of a database. This type of data is relatively easy to enter, store, query, and analyze. Unstructured data is more difficult to sort and extract value from. Examples of unstructured data include emails, social media posts, word-processing documents; audio, video and photo files; web pages, and more.
Beyond the Big Three Vs
More recently, big-data practitioners and thought leaders have proposed additional Vs:
-
Veracity
This refers to the quality of the collected data. If source data is not correct, analyses will be worthless. As the world moves toward automated decision-making, where computers make choices instead of humans, it becomes imperative that organizations be able to trust the quality of the data.
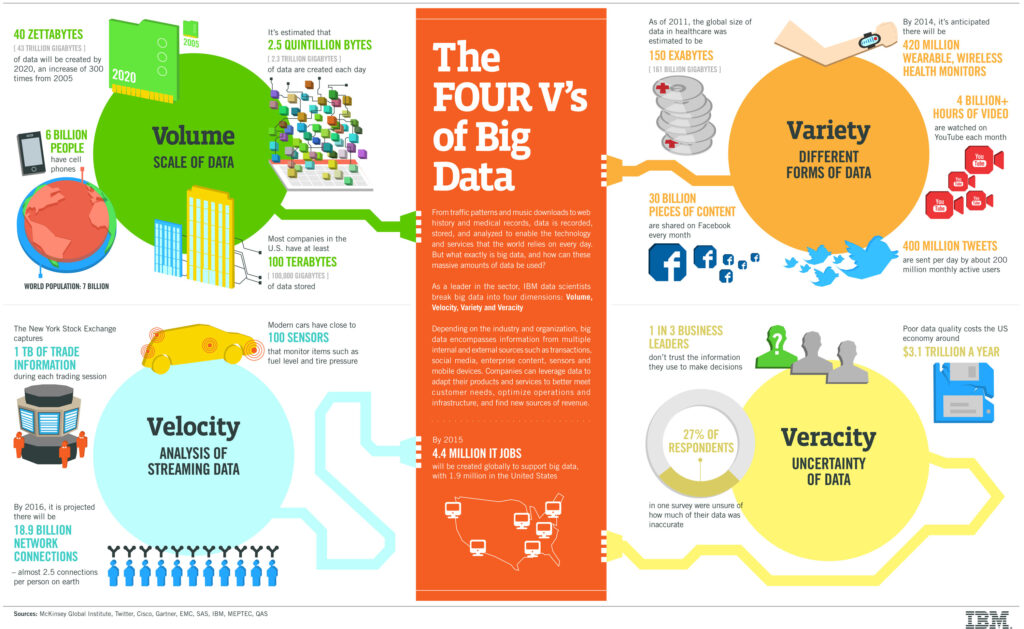
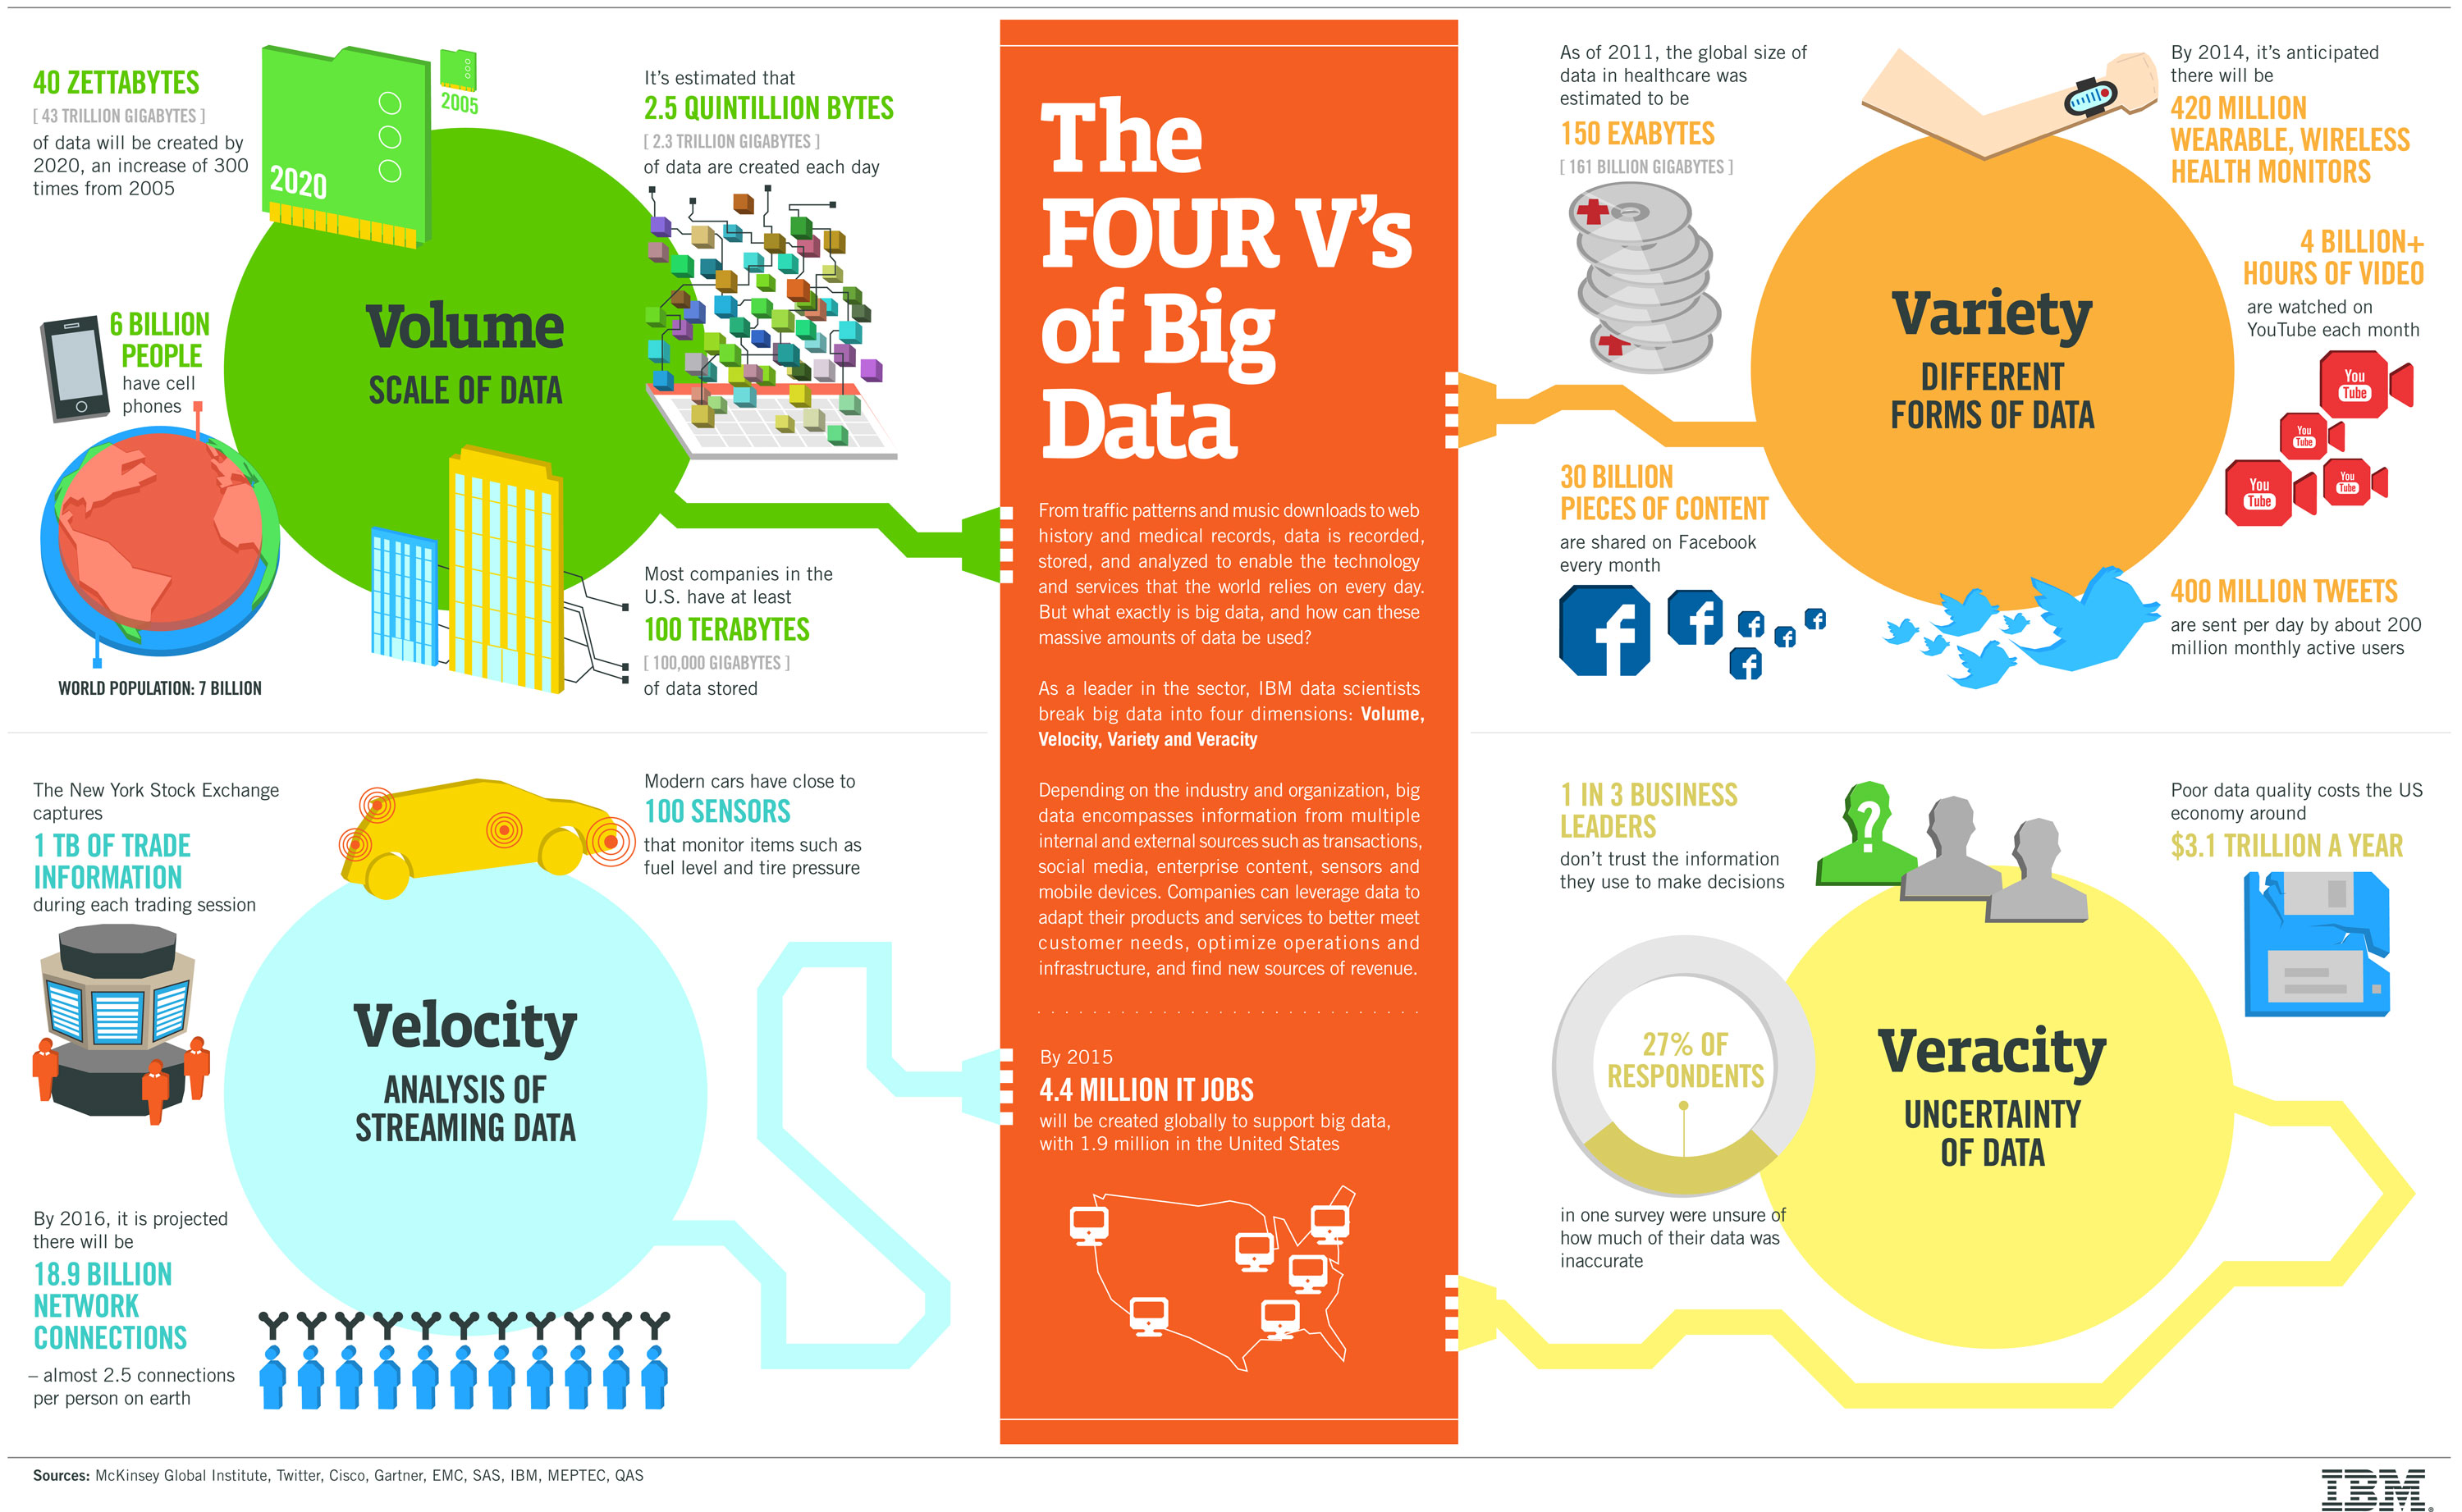
IBM data scientists break big data into four dimensions: volume, variety, velocity and veracity. This infographic explains and gives examples of each. -
Variability
Data’s meaning is constantly changing. For example, language processing by computers is exceedingly difficult because words often have several meanings. Data scientists must account for this variability by creating sophisticated programs that understand context and meaning.
-
Visualization
Data must be understandable to nontechnical stakeholders and decision makers. Visualization is the creation of complex graphs that tell the data scientist’s story, transforming the data into information, information into insight, insight into knowledge, and knowledge into advantage.
-
Value
How can organizations make use of big data to improve decision-making? A McKinsey article about the potential impact of big data on health care in the U.S. suggested that big-data initiatives “could account for $300 billion to $450 billion in reduced health-care spending, or 12 to 17 percent of the $2.6 trillion baseline in US health-care costs.” The secrets hidden within big data can be a goldmine of opportunity and savings.
Bringing It All Together
No matter how many Vs you prefer in your big data, one thing is sure: Big data is here, and it’s only getting bigger. Every organization needs to understand what big data means to them and what it can help them do. The possibilities really are endless.
___
What’s Next?
Discover
University of Wisconsin offers an online Master of Science in Data Science and an online Graduate Certificate in Data Science.
Explore
How much is a data scientist’s salary? Find out here.
Ask
Have questions about University of Wisconsin Data Science? Contact an adviser at 608-800-6762 or learn@uwex.wisconsin.edu.